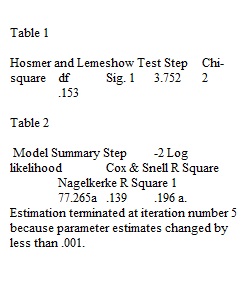


Q For this week’s homework assignment you will analyze data from a hypothetical case in which a marketing consultant for a cereal company investigates the effectiveness of a TV advertisement for a new cereal product. The consultant shows the advertisement in a specific community for one week. Then he randomly samples adults as they leave a local supermarket to ask whether they saw the advertisements (1=yes, 0=no) and bought the new cereal (1=yes, 0=no). He also asks them whether they had children (1=yes, 0=no) as well as what their annual household income was. Click on this link CerealPurchase.sav to access the data. Instructions: Open the data file CerealPurchase.sav Fit a binary logistic model to the data and report your results Click the following links and review the material on how to interpret logistic regression results and how to interpret odd ratios What are the odds of a consumer who viewed the advertisement buying the cereal compared to a consumer who did not view the advertisement? What are the odds of a consumer who has children buying the cereal compared to a consumer who does not have children? Does the model fit the data well? Explain. Is there evidence that the model does not fit the data well? Explain. Tips: Follow the first four steps, and step 6 of the instructions for SPSS EXAMPLE 9.2 on p. 306-315. For Step 2, you may run your analysis with, or without, the annual salary as a predictor / independent variable. While the initial results will show that the income variable should be removed, it is more important at this point that you understand how to read the results of the tables for odds and goodness of fit. For Step 3, make Children categorical. You should end up with several tables in your output. The main tables you need to analyze are the Variables in the Equation (Step 1) table and the Hosmer and Lemeshow Test table. The first should be used to report the odds, and the second to report the goodness of fit. Include all tables you analyze in your Word document along with your answers / analysis. Deliverables: Word document in APA style formatting addressing tasks 3 – 8 above
View Related Questions